
Unbalanced Twisted Pairs Can Give You the Jitters!
Abstract: This applicaTIon note proposes a new test method for predicTIng jitter contribuTIon for imbalance (asymmetry) in serial digital-video differenTIal cables. It exposes myths about intrapair skew as a quality indicator and about the misleading relationship between intrapair skew measurement and jitter. The article identifies the key problem as mode conversion between differential and common modes resulting from cable imbalance, as each mode has its own transmission velocity and loss characteristics. An economical cable test method of mode conversion is presented, with pass/fail criteria related directly to data jitter.
A similar version of this article was featured in Maxim's Engineering Journal, vol. 64 (PDF, 1.99MB).
The transmission of serial-digital video above 1Gbps (as required by the DVI™, HDMI™, and DisplayPort™ video-interface standards) has elevated the performance requirements for the cables that connect PC and HDTV monitors. Consequently, the traditional suppliers of analog audio/video cable must now learn the same lessons that makers of datacom serial-digital differential cables learned for InfiniBand™ and PCI Express® at 2.5Gbps, CX4 at 3.125Gbps, and Fibre Channel at 4.25Gbps.
This article highlights the phenomenon of data jitter caused by conversions between differential- and common-mode components of the video signal. It also exposes myths about intrapair skew, and proposes cable tests for the purpose of predicting jitter. The article demonstrates that differential cables with good performance need not be expensive, just well balanced.
The most common type of differential cable for digital-video signaling in the 0.25Gbps to 3.40Gbps range required by DVI/HDMI systems is 100Ω shielded twisted pair (STP). One-hundred-ohm twin-axial (twinax) cable is an alternative, and is a mainstay of datacom applications.
DVI, HDMI, and DisplayPort systems each include four lanes of differential interconnect for digital-video signaling. The signal can be recovered with inexpensive receive electronics, if two provisions are met: 1) the differential paths maintain the transmitted signals in differential mode, with little or no conversion to common mode; 2) the differential paths are balanced, which means that the two lines have symmetrical effects on the signal.
A cable that maintains signal energy in differential mode produces predictable phase delays and skin-effect losses across the frequency spectrum. Both effects are easily compensated. Otherwise, the signal may not be recoverable by an ordinary receiver. Indeed, conversion between differential and common modes in a coupled differential cable (STP or twinax) is an aberration that destroys the ability to predict phase delay and signal loss.
A related measurement of signal corruption is intrapair skew, which results from different propagation delays on the two lines of a differential pair. To illustrate, consider a pair of twin-coax cables cut into different lengths (Figure 1). The input is differential; that is, no common-mode voltage is present. The output, however, contains intrapair skew equal to the difference in propagation delays. Along with intrapair skew you find common-mode energy, as well as reduced differential-mode energy.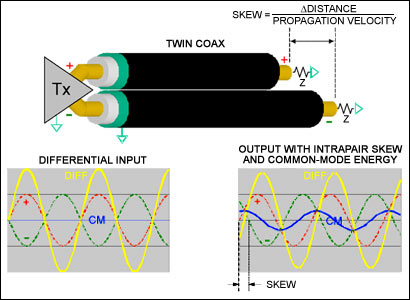
Figure 1. Simple intrapair skew converts some differential signal to common-mode (CM) energy.
The stimulus used in this example is sinusoidal, rather than a digital nonreturn-to-zero (NRZ) waveform. Skew delay for the simple twin-coax cable in Figure 1 is constant over frequency. In STP or twinax cables, however, each sinusoidal (Fourier) component of a digital NRZ waveform suffers a different amount of skew.
A commonly measured symptom of conversion between differential- and common-mode energy, intrapair skew is frequently used by cable manufacturers as a QA test for cables. However, the conventional methods for measuring intrapair skew provide misleading results that are not predictive of jitter.
This statement is true for uncoupled differential pairs like twin coax, but it is not true for coupled cables such as STP and twinax. Figure 2 illustrates this effect for 28AWG twinax. Intrapair skew can actually reverse its polarity at different frequencies.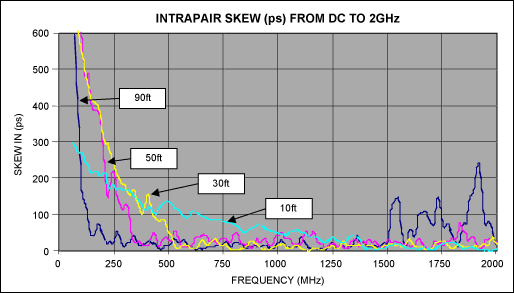
Figure 2. Intrapair skew vs. frequency for 28AWG twinax.
This characteristic is true at very low frequencies (wavelength long compared to the cable length), but it is not true at high frequencies for coupled cables such as STP and twinax. Figure 2 shows the intrapair skew for various lengths of 28AWG twinax. Note that between 300MHz and 1500MHz, the 10-foot length has the worst intrapair skew.
This test launches a differential or single-ended voltage step into one end of a cable, and measures the time difference (skew) between (+) and (-) edges at the other end. Unfortunately, the cable itself lowpass-filters these output edges, and that effect is dramatic in long cables. Thus, the method demonstrates low-frequency intrapair skew, but says nothing about the high-frequency intrapair skew that matters most for serial-digital video!
Again, intrapair skew is a function of frequency in STP and twinax cables. Figure 3, for instance, shows measurements on a 50m 22AWG STP cable for DVI systems. Note that the step method predicts intrapair skew of 300ps, which is about one half period (0.5UI) at the 1.65Gbps video rate necessary for WUXGA displays. The cable, therefore, fails intrapair skew requirements for the DVI/HDMI standards. Yet, the receiver's equalized eye diagram looks great, because the high-frequency intrapair skew is very low in this cable, allowing excellent performance at 1.65Gbps. The step method only examines low-frequency intrapair skew. So, do not throw that cable away!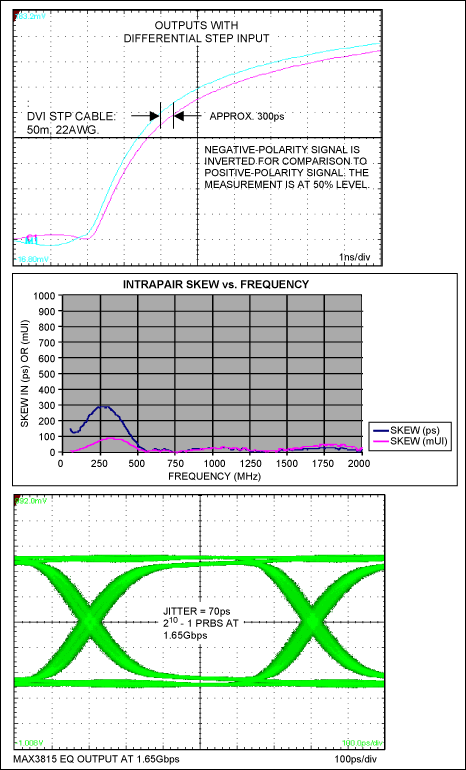
Figure 3. Step method fails to predict serial data jitter.
As shown in Figure 4, coupled cables (STP, UTP, twinax) derive their differential characteristic impedance both from coupling between the (+) and (-) lines of a pair (Z1), and coupling of each side to ground (Z2, Z3). Any imbalance in a differential pair, such as asymmetry of length, or twist, or dielectric environment (in which Z2 ≠ Z3), causes a differential-to-common-mode conversion with measurable symptoms, such as intrapair skew.
Figure 4. Uncoupled (twin coax) and coupled (twinax, STP) 100Ω differential pairs.
As a further complication in coupled cables, the differential- and common-mode signals have different propagation velocities, which can amount to several nanoseconds of difference over the length of a long cable. As the differential energy converts to common-mode and back again, it returns with arbitrary phase. This effect is one source of differential-mode jitter. When the signal is able to convert freely between the two modes, the cable frequency and phase responses are no longer predictable.
Differential- and common-mode signals also have different loss rates (in dB/m) due to the skin effect. This behavior is not all bad, because it can be used to advantage: a cable whose common-mode loss is significantly higher than its differential-mode loss has little intrapair skew. A cable with no common-mode energy at the output end has no intrapair skew at all. As an extreme example, any high-frequency common-mode energy in a CAT5 UTP cable dissipates as EMI (because it has no shield), leaving only differential-mode energy. Again, there is no intrapair skew.
The simple model of double conversion (differential mode to common mode and back) serves well here, though it is clearly a lumped approximation of a continuous process. Mode conversion is progressive and can be partial or multigenerational, depending on the cable length relative to wavelength (Figure 5).
Figure 5. Illustration of mode conversion along cable length.
Note that common-mode energy by itself does not impart timing jitter to differential signaling. Rather, mode conversions corrupt the signal by permitting a return of incoherent signals back into the differential mode. So, the measurement of common-mode energy (given a differential stimulus) provides evidence for mode conversion, from which we can then estimate the differential-mode jitter.
A measurement of cable quality should be predictive of digital-video signaling quality. For instance, it should predict zero-crossing jitter in the data, which is the residual jitter that remains due to cable imbalances after an ideal equalization of skin-effect and dielectric losses in the receiver. Intrapair skew measurements using the step stimulus are inadequate for predicting jitter.
We therefore propose the measurement of differential-to-common-mode conversion as a better predictor of data-jitter contribution from cable imbalance. Ideally, only differential-mode, and not common-mode, energy remains at the cable output. If common-mode energy is present, the cable has some imbalance and has converted some differential energy to common mode.
As a heuristic justification, we can use a simple model that has a sine-wave differential source at the cable input.
- Assume that a fraction of the sine-wave energy is converted from differential to common mode in the cable, and by symmetry the same fraction is converted back to differential mode. Using S-parameter naming conventions, the two conversion factors are SCD21 and SDC21, respectively (note that output ports are named first):
- SCD21 is differential-mode to common-mode conversion from Port 1 to Port 2
- SDC21 is common-mode to differential-mode conversion from Port 1 to Port 2
- SCD21(magnitude) = SDC21(magnitude) is a good approximation in real-world cables
- SDD21 is differential-mode transfer from Port 1 to Port 2
- Assume that the energy making the full conversion (from differential to common mode and back) returns with arbitrary phase. This behavior results from differences in the propagation velocity between differential and common modes, which is typical in STP and twinax. It also assumes a cable of sufficient length to exhibit a delay difference greater than the sine period.
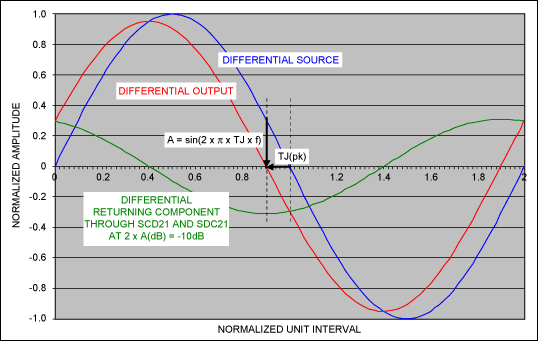
Figure 6. Offset in the zero-crossing time TJ(pk) is caused by SCD21 and SDC21. All waveforms shown are differential signaling (single ended not shown).
The zero crossing of a differential sinusoidal component can be shifted by TJ(pk), due to a returning version of itself through SCD21 and SDC21 (Figure 6). Note the returned differential component, whose maximum amplitude at the zero crossing of the differential output signal causes the worst-case skew. The returned amplitude, A(dB), required to introduce TJ(pk) jitter relative to the total differential output level (SDD21) is:
Because a good approximation for real-world cables is SCD21(magnitude) = SDC21(magnitude), the difference between common-mode and differential-mode levels at the cable output lets you measure the quality of a cable that imparts less than TJ(pk-to-pk) jitter due to imbalance:
Where added jitter due to imbalance is:
TJ(pk-to-pk) = 2 × TJ(pk)
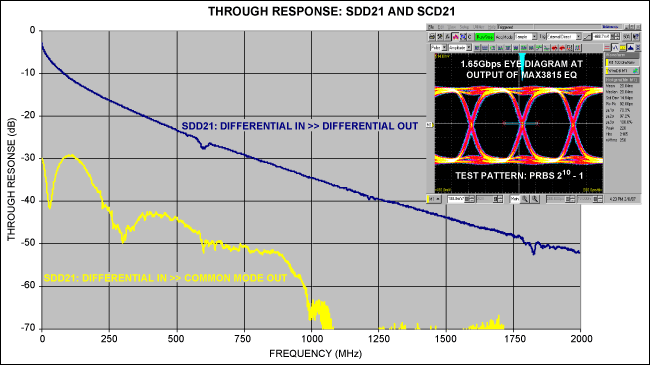
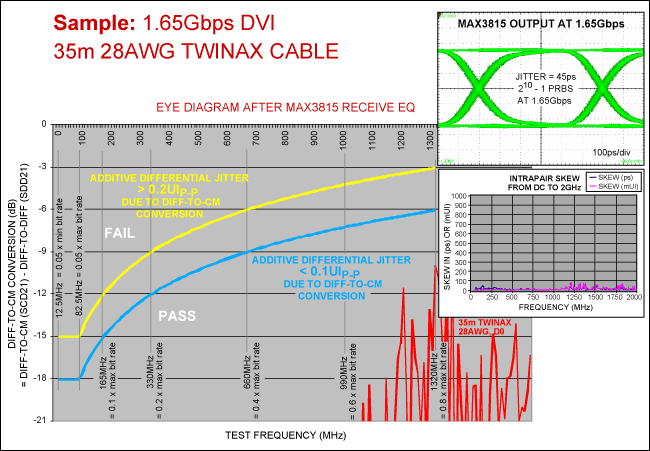
Figure 7 shows the common- and differential-mode responses of a cable, and Figure 8 plots their difference, showing common-mode relative to differential-mode outputs. Figure 8 also includes templates for 0.1UI and 0.2UI (lines of constant error in the differential zero-crossing TJ[pk]), where UI is the unit interval for the bit period at the given data rate. For example, the 0.1UI jitter line calculated for 1.65Gbps (WUXGA) represents a constant maximum zero-crossing error of 60psP-P.
More detailed image (PDF, 314kB)
Figure 7. Frequency response of a 60m cable, showing common-mode output (SCD21) and differential-mode output (SDD21). Data is gathered on the MAX3815 TMDS digital-video equalizer.
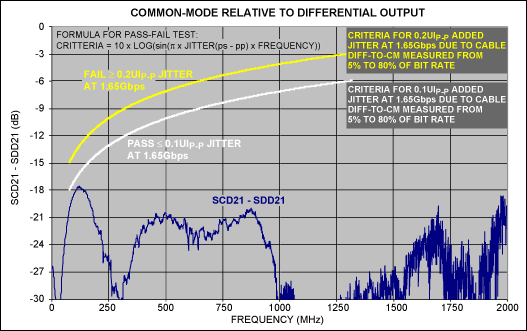
Figure 8. Plot of (SCD21 - SDD21) difference, with pass/fail template superimposed.
Template Interpretation and Simplification
If the cable measurement in Figure 8 (SCD21 - SDD21) reaches the 0.1UI line at any point, cable imbalance creates a potential for 0.1UIP-P jitter. That is, if a spectral component in the data-signaling sequence coincides with a frequency at which the cable measurement touches the 0.1UIP-P template, the zero-crossing error (phase-shift range) for that spectral component is 0.1UIP-P (60psP-P).
DVI and HDMI TMDS® signaling is not scrambled, so the harmonic content of its frequency spectrum changes according to data content. It is, therefore, reasonable to assume that the entire spectrum will get "exercised" over time, with dominant components falling roughly between (data rate)/20 and (data rate) × 0.8. (Note that the sinc² power function of an NRZ data signal goes to zero at frequency = data rate.)
Figure 9 shows a simplified pass/fail template, derived from the formula in Eq. 2. The 0.1UIP-P template is -11dB from 0.05 to 0.25 times the maximum bit rate, and a flat ramp up to -6dB at 0.8 times the maximum bit rate. The template simply scales with the maximum operating bit rate specified for the cable (1.65Gbps, in this case).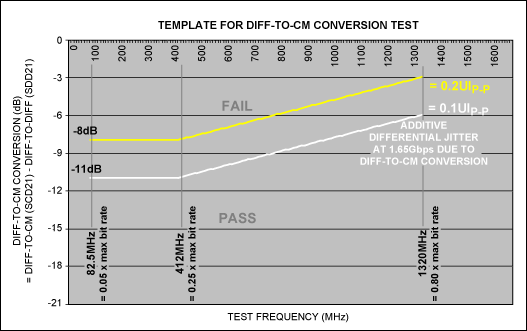
Figure 9. Simplified test template, for which 0.1UIP-P pass/fail criteria are recommended.
This simplified template also takes into account harmonic support for fundamentals less than 0.25 times the max bit rate. Figure 10 shows the underlying formula curve (fundamental only), as well as the offsets for 2-component and 3-component mitigation of jitter at low frequency.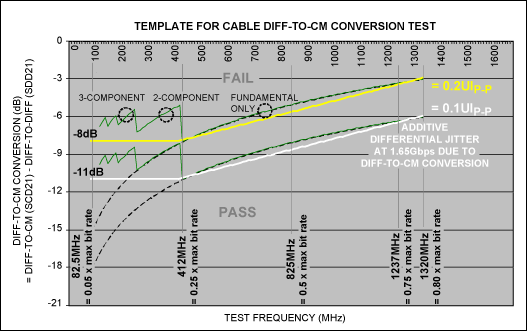
Figure 10. Simplified test template, with underlying family of curves shown for fundamental-only and multiple-harmonic cases.
NRZ data patterns with fundamentals below 0.25 times the max bit rate contain harmonics that help mitigate the errant return of a single component that has suffered mode conversion. Fundamentals above 0.25 times the max bit rate are likely not to have harmonics that matter, because the frequency response of equalizer and receiver circuits typically rolls off above 0.75 times the max bit rate (i.e., the 3rd harmonic of the fundamental at 0.25 times the max bit rate).
Numerous tested cables exhibit maximum jitter potential at a single worst-case frequency. In conjunction with the signal's varying harmonic content, this effect supports the assumption of a single worst-case tone for the template.
The allowed jitter budget for a DVI/HDMI TMDS cable interconnect (including connectors and equalization) is roughly 0.2UIP-P total added jitter, which is the difference between a TMDS Tx mask and Rx mask. The 0.2UIP-P template lines just meet this criteria, and allow no room for other jitter contributors in the channel.
Hence, the 0.1UIP-P pass/fail template line in Figure 10 is the basic recommended criterion, given its margin for other jitter contributors in the channel—such as connectors and residual jitter from equalization and switching. Tighter criteria are possible for premium cable performance; you could use a 0.05UIP-P pass/fail template, for example.
We recommend direct measurements of differential-to-common-mode conversion (SCD21), relative to the differential through response (SDD21), as the most diagnostic, flexible, and economical test method. The objectives are:
- Test results that are predictive of NRZ signaling with equalized jitter performance
- An economical test method—it should not require expensive oscilloscopes or network analyzers
- A simple pass/fail test template
A 4-port S-parameter network analyzer configured as a 2-port differential analyzer (Figure 11) measures SDD21 and SCD21 directly, but its price ($50k to $100k) does not satisfy the second objective above. As an alternative, you can measure SDD21 and SCD21 accurately using a low-cost test setup (Figure 12) that consists of a sine generator, two baluns, and two power meters (or one 2-input power meter). These items have been around awhile, so you can easily stay under $10k by taking advantage of the used-equipment market.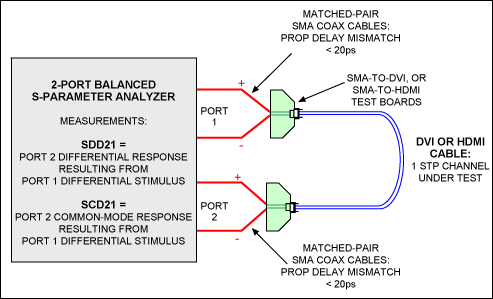
Figure 11. This 4-port S-parameter network analyzer is configured as a balanced 2-port analyzer.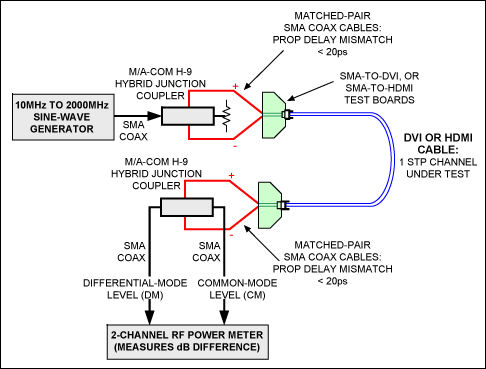
Figure 12. This test setup features a low-cost generator, couplers, and power meters.
Key components in this test setup are the model H9-SMA couplers from M/A-COM (a division of Tyco Electronics®), specified from 2MHz to 2GHz. The first coupler generates the differential source signal from a single-ended sine-wave generator, while the second coupler separates differential- (SDD21) and common-mode (SCD21) signals for measurement.
Use good quality SMA cables, and matched-length pairs where indicated. SMA-to-DVI/HDMI test boards are available from Tektronix® and Agilent™. Measure (SCD21[dB] - SDD21[dB]) across the frequency range of interest, and then plot it against the pass/fail templates.
Digital-video data can be recovered from long cables using inexpensive receive electronics, provided that the cables impose little or no differential-to-common-mode conversion. Such cables exhibit predictable phase delay and loss across the frequency spectrum, which is easily compensated. This statement is not true if the cable has excessive differential-to-common-mode conversion.
Intrapair skew is widely misunderstood as a measure of quality for the STP and twinax cables used in DVI, HDMI, and DisplayPort digital video. Beware that the traditional methods for measuring intrapair skew using a step stimulus give misleading answers for the purpose of separating good from bad cables for serial-digital video. Thus, a direct measurement of the key culprit—differential-to-common-mode conversion resulting from cable imbalance—is recommended as the most direct, flexible, and economical test method.
More detailed image (PDF, 298kB)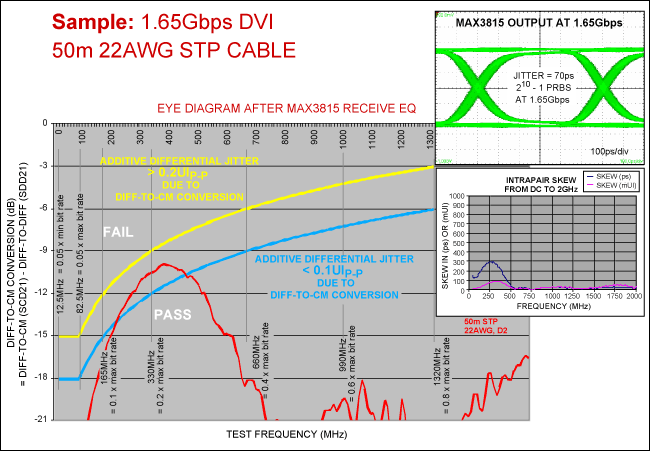
More detailed image (PDF, 297kB)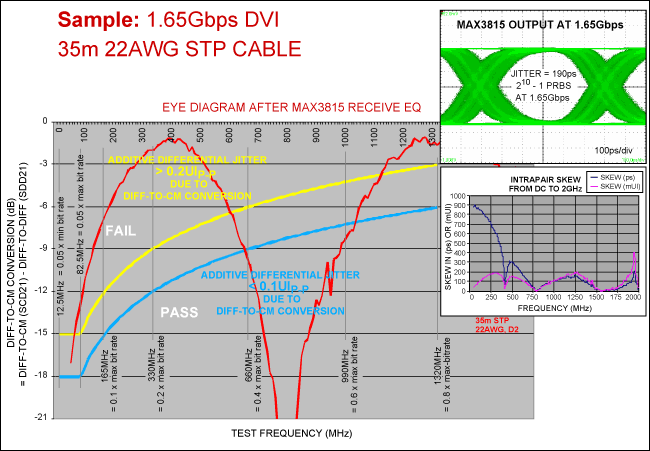
More detailed image (PDF, 313kB)
Skin-effect and dielectric loss are the dominant high-frequency loss mechanisms in a cable. Fortunately, commercial DVI/HDMI equalizer ICs (such as the MAX3815) are available to extend cable reach by economically compensating these losses.
Skin-effect loss (in dB) is proportional to cable length and to the square root of frequency. Dielectric loss (in dB) is proportional to cable length and frequency. Skin-effect loss dominates from low to mid frequencies, and dielectric loss dominates at high frequencies.
Such losses introduce jitter due to ISI (inter-symbol interference). An uncompensated loss of 6dB to 8dB at half the bit rate increases jitter, and lowers amplitude, to full closure of the eye diagram displayed on an oscilloscope. By compensating these losses, economical equalization can remove the ISI-related jitter and restore signal amplitude.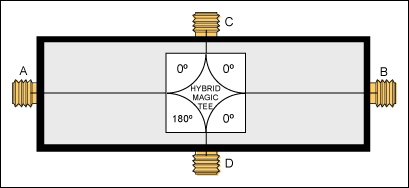
Frequency Range: 2MHz to 2000MHz
Impedance: 50Ω
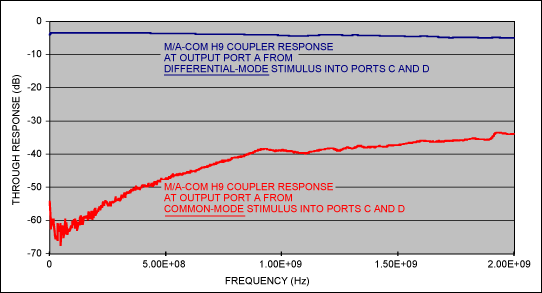
Transmission Through-Loss: 3.4dB to 4.8dB (see graph below)
Mode Isolation: 30dB (min, see graph below)
The plot below shows Application 2, with the outputs of ports A and B in response to inputs at ports C and D. The upper line (port A) is the differential stimulus at ports C and D, and the lower line (port B) is the common-mode stimulus at ports C and D.
The author would like to thank Chad Nelson for his invaluable assistance in setting up the test beds and taking all the measurements used to confirm the performance results.
Agilent is a trademark of Agilent Technologies, Inc.
DisplayPort is a trademark of Video Electronics Standards Association.
DVI is a trademark of Digital Display Working Group (DDWG).
FireWire is a registered trademark of Apple Computer, Inc.
HDMI is a trademark of HDMI Licensing, LLC.
InfiniBand is a trademark of System I/O, Inc., DBA InfiniBand Trade Association.
PCI Express is a registered trademark of PCI-SIG Corp.
Tektronix is a registered trademark of Tektronix, Inc.
TMDS is a registered trademark of Silicon Image, Inc.
Tyco Electronics is a registered trademark of Tyco International Services, GmbH.
欢迎分享,转载请注明来源:内存溢出

 微信扫一扫
微信扫一扫
 支付宝扫一扫
评论列表(0条)