Histogram Testing Determines DNL and INL ErrorsToday manufacturers of data converters frequently use the histogram method to verify the integral (INL) and differential (DNL) non-linearity specifications of their data converters. This approach, also referred to as code density test, is performed in the amplitude-domain of a data converter. During a histogram test a repetitive, dynamic signal with a bathtub distribution (e.g. sine-wave signal) is applied to the analog-to-digital converter (ADC), generating a corresponding distribution of digital codes at the output of the converter. Any deviation from the corresponding output code distribution results in various errors that may be estimated with the histogram method. These error parameters include first and foremost DNL and INL.
For an ADC, given an analog input signal, the histogram shows how many times each different digital code word appears on the ADC output. One method of histogram testing involves the sampling and digitizing of a sinusoidal-input signal. The digitized information is then sorted into code bins. Each code bin represents a single output code. Depending on the input signal, the number of samples, or hits for each bin is collected. With N representing the ADC's resolution or total number of bits, there will be 2N code bins. For an ideal ADC, each code bin width should correspond to a bit width of FSR/2N, where FSR is the full-scale range of the ADC in volts. In the real world however, code bin widths for ADCs may not be the same. For instance, if the number of collected samples (for a known input signal) in a code bin is greater than expected, than this number would indicate that the code bin width is larger than ideal (statistically-speaking).
The frequency of code samples is displayed as a function of code. For an ideal ADC, this plot will be the probability density function, p(V), of a sine wave represented as follows
p(V) = 1 / (π × √[A² - V²])
Having established this mathematical relationship, the size of the sample array must be determined.
But what size data record represents a statistically significant number of samples?
The probability density function will help answer this question. For a given probability density function and data record size, each code bin of an ideal ADC identifies an expected number of samples and its correlating standard deviation. The confidence that the number of samples in the code bin is close to the expected level is equal to the probability that the samples fall within the appropriate number of deviations. Note that the ratio between standard deviation and expected values decreases with an increasing number of samples in the data record. To obtain a confidence level for the entire range, the probability for all codes falling within the desired code are multiplied together.
To calculate the probability of each code for the recorded data array requires the number of samples for each code to be divided by the number of samples in the data record. The ideal probability of samples is what an ideal ADC would generate with a pure sine wave applied to the input of the converter. Integrating the probability density function for a sine-wave-based input signal over the number of bins allows the exact size of each code bin to be calculated as follows
P(n) = 1/π × [arcsin(FSR × {n-2N-1} / A × 2N) - arcsin(FSR × {n-1-2N-1} / A × 2N)],
where n represents the code bin number, FSR is the full-scale range and N is the resolution of the ADC. The deviation between measured (actual) and ideal histogram at each output code is a function of the code size, which can be used to determine the data converter's DNL. DNL can be computed as follows
DNL (LSB) = [AP(nth code) / IP(nth code)] -1
where n represents the code bin number ranging from 1 to 2N, N is the resolution of the ADC, AP(nth code) expresses the measured histogram of samples in code bin n and IP(nth code) is the ideal (expected) histogram of samples in code bin n.
Unfortunately the histogram method requires the capture of fairly large data records. The number of samples required is depending on the resolution of the ADC, the desired confidence level of the measurement, and the size of the DNL error. For instance, a 10-bit ADC with a DNL error (β) of 0.1LSB and a 95% confidence level (Zα/2) requires more than half a million samples (NRECORD) to be recorded. Boosting the confidence level from 95% to 99% will result in a significantly higher data record size of more than one million samples.
NRECORD = π × 2N-1 × (Zα/2)²] / β² = π × 29 × (1.96)² / (0.1)² = 617,920
NRECORD = π × 2N-1 × (Zα/2)²] / β² = π × 29 × (2.58)² / (0.1)² = 1,070,678
As the resolution of the ADC increases, the number of required samples to satisfy confidence level and error resolution multiplies by a factor of two for each bit added to the converter's resolution. For ADC with 12 bits resolution and higher this test may eventually become the limiting factor in measuring DNL, as it requires massive data storage capabilities to host the more than four million data points required. Although an increase in record size and resolution leads to the undesired and cost intensive side effect of prolonged lab and production test time, introducing a so-called hardware histogram generator can help to reduce test time. Test time for such generators is defined as the ratio between record size and sampling rate of the ADC.
Determining DNL through the histogram method can be challenging, as this test is sensitive to amplitude variations of the input sine wave, noise, clock jitter and converter hysteresis. In this case the use of a cumulative histogram test may be the better choice to calculate INL and DNL errors. To do that, the offset and transition voltages for the ADC have to be determined. To find the offset error in the collection of digitized data points, equate the number of positive and negative samples in the data records (NRECORD = NRECORD[P] + NRECORD[N]) as follows
2N-1
NRECORD[N] = ΣAP(nth code)
n=1
2N
NRECORD[P] = Σ AP(nth code)
n=2N-1 + 1
VOFFSET = 0.5 × A × π × sin[(NRECORD[P]-NRECORD[N]) / (NRECORD[P] + NRECORD[N])]
With the offset error calculated, the transition voltages or code edges (Vj) can be found by using the following mathematical expression
j
Vj = -A × cos [π × (Σ AP(nth code) / NRECORD)]
n=1
With the transition voltages known, the calculation for INL and DNL parameters becomes independent from the input amplitude of the sine-wave signal and can be calculated with the following formula
j
INLj (LSB) = Σ DNLj (LSB)
n=1
DNLj (LSB) = (Vj+1 - Vj) × (2N/FSR)
where DNLj is the difference between two adjacent codes and INLj represents the sum of all DNLj errors. FSR is the full-scale range and N is the resolution of the ADC for which INL and DNL are measured.
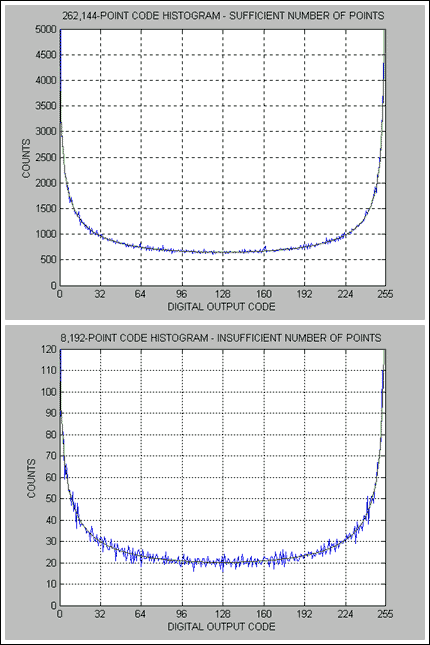
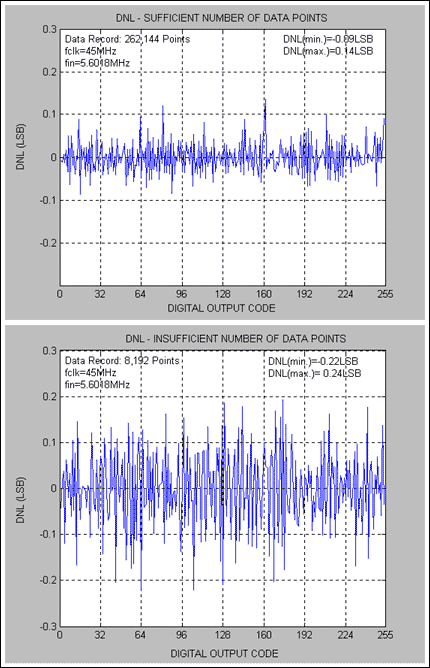
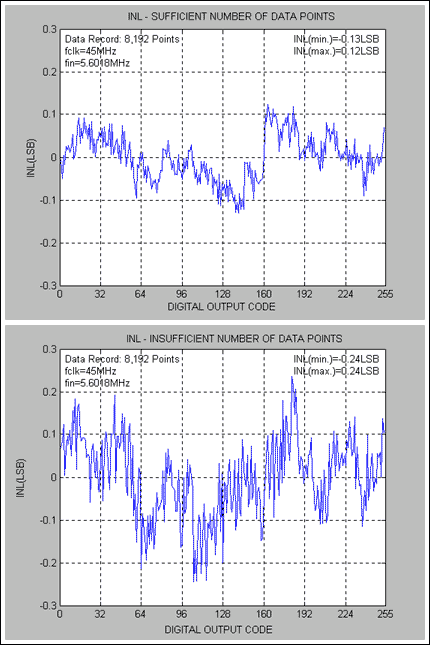
The following figures illustrate the histogram, INL and DNL performance of the MAX1193, an 8-bit, low-power 45Msps ADC. In case of the MAX1193, INL and DNL tests were performed with a 5.6018MHz sinusoidal input signal. Note that Figure 1 represents a histogram comparison between a sufficient and insufficient number of code counts. Figure 2 and 3 depict the resulting DNL and INL performances under these (sufficient and insufficient sample sizes) conditions.

Figure 1. Sufficient Code Count vs. Insufficient Code Count Histogram Display for MAX1193.

Figure 2. DNL Discrepancies for Sufficient Code Count vs. Insufficient Code Count - MAX1193.

Figure 3. INL Discrepancies for Sufficient Code Count vs. Insufficient Code Count - MAX1193.
Matlab Code For Code Density Testing to Determine INL and DNLDownloadable Matlab source code example (M, 2KB)
%Code density/histogram test to calculate INL and DNL require a large number of samples.
%Step 1: Apply a close to full-scale sine wave (but not clipping) and find the mid-code
%for the applied signal.
%Step 2: Apply the same sine wave input, but slightly larger amplitude to clip the ADC
%slightly.
%Run the following program, enter the number of samples, resolution and mid-code from
%Step 1and continue.
%Copyright Au/Hofner, Maxim Integrated Products, 120 San Gabriel Drive, Sunnyvale,
%CA94086
%This program is believed to be accurate and reliable. This program may get altered
%without prior notification.

filename=input('File Name or press ENTER for Listing Transfer HP16500C: ');
if isempty(filename)
   filename = 'listing';
end
fid=fopen(filename,'r');
numpt=input('Number of Data Points?  ');
numbit=input ('ADC Resolution?  ');
mid_code=input(Enter Mid-Code (Mean):  ');

for i=1:13,	%Discard 13 lines of redundant or header-related HP16500C data
   fgetl(fid);
end
[v1,count]=fscanf(fid,'%f',[2,numpt]);
fclose(fid);

v1=v1';
code=v1(:,2);
code_count=zeros(1,2^numbit);  %Code count

for i=1:size(code),
   code_count(code(i)+1)=code_count(code(i)+1) + 1;
end

%Routine to detect whether the ADC's input is clipping or not
if code_count(1) == 0 | code_count(2^numbit) == 0 | ...
  (code_count(1) < code_count(2)) | (code_count(2^numbit-1) > code_count(2^numbit))
   disp('Increase Sine-Wave Amplitude to Slightly Clip the ADC!!!');
   break;
end

A=max(mid_code,2^numbit-1-mid_code)+0.1; %Initial estimate of actual sine wave amplitude

vin=(0:2^numbit-1)-mid_code;	%distance of codes to mid code
sin2ramp=1./(pi* sqrt(A^2*ones(size(vin))-vin.*vin));	%sin2ramp*numpt is the expected
%Count each code; keep increasing estimate of A until the actual total number of counts from
%code 1 to 2^numbit-2 matches with that predicted by sin2ramp*numpt
while sum(code_count(2:2^numbit-1)) < numpt*sum(sin2ramp(2:2^numbit-1))
  A=A+0.1;
  sin2ramp=1./(pi* sqrt(A^2*ones(size(vin))-vin.*vin));
end

disp('You Have Applied a Sine Wave of (dBFS): ');
Amplitude=A/(2^numbit/2)
figure;
plot([0:2^numbit-1],code_count,[0:2^numbit-1],sin2ramp*numpt);
title('CODE HISTOGRAM - SINE WAVE');
xlabel('DIGITAL OUTPUT CODE');
ylabel('COUNTS');
axis([0 2^numbit-1 0 max(code_count(2),code_count(2^numbit-1))]);
code_countn=code_count(2:2^numbit-1)./(numpt*sin2ramp(2:2^numbit-1)); %End points discarded!
figure;
plot([1:2^numbit-2],code_countn);
title('CODE HISTOGRAM - NORMALIZED')
xlabel('DIGITAL OUTPUT CODE');
ylabel('NORMALIZED COUNTS');

dnl=code_countn-1;	%DNL=Vj+1-Vj-1LSB where Vj represents a transition point
			%Vj+1-Vj is proportional to normalized code count

inl=zeros(size(dnl));
for j=1:size(inl')
   inl(j)=sum(dnl(1:j));	%INL,j=DNL,0+DNL,1+...+DNL,j
end
%INL still contains the offset and gain error!;

%INL with end-points fit, i.e. INL=0 at end-points the straight line joining the 2 end points
%[p,S]=polyfit([1,2^numbit-2],[inl(1),inl(2^numbit-2)],1);
%the best-fit straight line
[p,S]=polyfit([1:2^numbit-2],inl,1);
inl=inl-p(1)*[1:2^numbit-2]-p(2);

disp('End Points Eliminated for DNL and INL Calculations');
figure;
plot([1:2^numbit-2],dnl);
grid on;
title('DNL');
xlabel('DIGITAL OUTPUT CODE');
ylabel('DNL (LSB)');
figure;
plot([1:2^numbit-2],inl);
grid on;
title('INL (BEST END-POINT FIT)');
xlabel('DIGITAL OUTPUT CODE');
ylabel('INL(LSB)');
Footnotes
- V=A×sin[ωt], where V represents the independent variable (in this case a voltage) and A is the amplitude of the sine wave.
- An ideal histogram is the probability of code within a given bin multiplied by the number of samples in the record.
- The confidence level is the probability value (1-α) associated with a confidence interval. The confidence level is usually expressed in percent. For instance, if α = 1% then the confidence level is equal to 1 - 0.01 = 0.99 or 99% confidence level.
The confidence level values used in the NRECORD calculation originate from Table 2 of the IEEE Standard 1241 Draft, printed on May 12th, 1997 - Standards for Terminology and Test Methods for Analog-to-Digital Converters Prepared by the Analog-to-Digital Converter Subcommittee of the Waveform Measurements and Analysis Committee of the IEEE Instrumentation and Measurement Society
- The cumulative histogram is a variation of the commonly used histogram. In the cumulative histogram, the y-axis does not only provide the sample counts for a single code bin, but rather displays the sample counts for that code bin plus all code bins for smaller values.
欢迎分享,转载请注明来源:内存溢出

 微信扫一扫
微信扫一扫
 支付宝扫一扫
评论列表(0条)